Reading time - 7 mins
1. ML Picks of the Week
A weekly dose of ML tools, concepts & interview prep. All in under 1 minute.
2. Technical ML Section
Learn 5 Practical Tips for Time Series Analysis from my experience
3. Career ML Section
Learn 3 tips that can help you grow your ML career income
1. ML Picks of the Week
🥇ML Tool
Python Library StatsForecast
StatsForecast is a computationally efficient library for time series forecasting, built for scale and performance.
It offers state-of-the-art implementations of classic statistical models like ARIMA, ETS, and AutoETS — all written in Numba for speed.
StatsForecast is especially powerful for:
✅ Running thousands of forecasts in parallel (yes, really fast)
✅ Getting accurate baselines for production models
✅ Automating time series pipelines with minimal code
If you’re still waiting minutes for ARIMA to run in loops, switch to StatsForecast.
📈 ML Concept
Gini Impurity
The Gini impurity is a metric used in decision trees to decide how good a split is.
It measures how mixed the classes are in a node — the lower the Gini value, the purer the node (i.e., more of the same class).
It’s fast to compute and works especially well for classification tasks.
Gini is the default split criterion in many algorithms like CART and Random Forest.
Gini is especially useful for:
✅ Building fast and interpretable classification trees
✅ Selecting the most informative features
✅ Creating consistent and efficient splits in large datasets
Read a more detailed explanation of Gini Impurity HERE.
🤔 ML Interview Question
What is one-hot encoding?
One-hot encoding is a common way to convert categorical variables into a format that machine learning models can work with.
It creates a new binary column for each unique category, assigning 1 to the matching category and 0 to the rest.
Example:Color = Red → [Red: 1, Green: 0, Blue: 0]
Why is this important?
→ Most ML models (like linear models or neural nets) can’t work directly with text.
→ One-hot ensures that the model doesn’t assume any order or ranking between categories.
→ It’s simple, reliable, and widely used in preprocessing pipelines.
Read a more detailed intro to one-hot encoding HERE.
2. Technical ML Section
5 Practical Tips for Time Series Analysis
Analyzing time series might seem easy. But in real-world cases, it's not because of many reasons, like:
- Nan values
- Outliers
- Noise
- Inconsistent timestamps
- Long, hard-to-analyze sequences
In this newsletter, you'll learn 5 practical tips I learned over 7 years in time series analysis. They'll help you to extract more value from data in your projects.
1️⃣ Before computing correlation, remove outliers
This tip is especially important when you are selecting features for your model or trying to understand feature relationships.
Imagine you have 2 time series, both having outliers as in the figure below. It can be 2 features or 1 target and 1 feature.

You see that there are some outliers, but they might not be significant for your analysis, because compared to the entire sequence, their fraction is 1-2%.
If you compute the Pearson correlation between these series, you will get 0.32.
However, if you first remove them, as shown in the figure below, your correlation will reach 0.42. Big difference for practical use cases.

2️⃣ Apply resample (groupby) over a bigger time horizon than the original sampling frequency
This usually helps to remove noise and see the general relationships much better, including correlation.
In pandas, you can do this with "resample" method in Pandas.
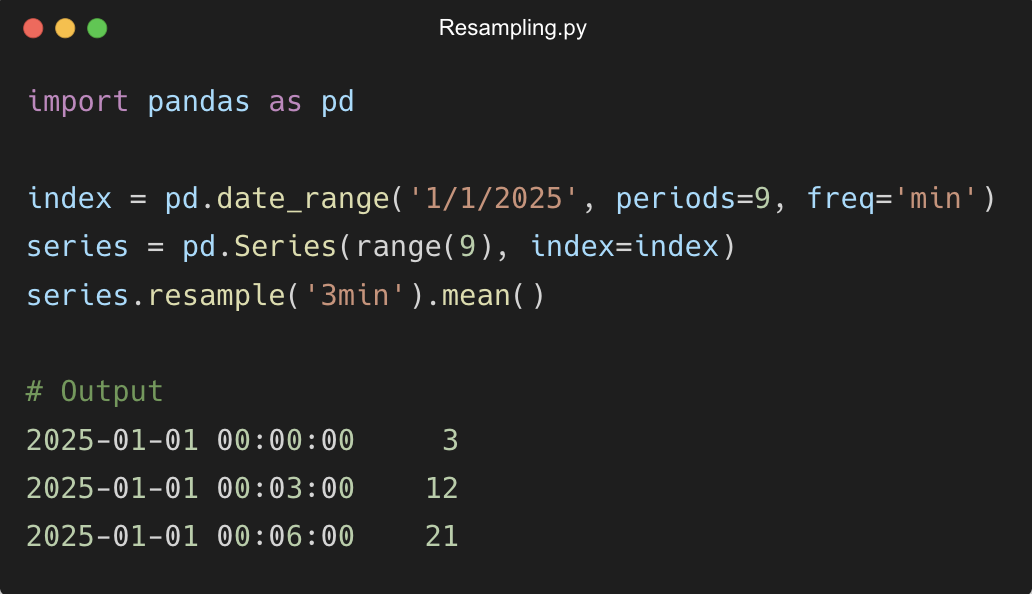
Another alternative is "groupby".
Using resampling for our dataset significantly improves observability of the relationship as well as the correlation value (from 0.32 to 0.65).

3️⃣ Don’t use scatter, use regression and contour (kdeplot in seaborn) plots
This tip saved me a lot of time from the troubles.
Pro tip: combine regression and contour plots with resampled data from Tip 2.
Here is the original dataset with scatter, regression, and contour plots.

Here are the same plots on the grouped data. Now, compare the regression and contour plot below with the scatter plot above.
Way easier to see the relationships.

4️⃣ Use Median filter to see the relationships through noise
Often, when you visualize the raw data, it's really hard to see if the data goes down/up/straight due to high noise.
Median filter is a very quick and easy way to see the time series trends and get an overall view of the time series behavior.
You can see how filtering the noise helps us to see the trends and cyclic behavior of our time series below.

To apply a median filter, you can use pandas rolling.
5️⃣ Use Plotly to scroll and zoom in through the time series
Plotly library makes it much quicker to go through the data and find insights rather than zooming and scrolling through changing the plotted indices in matplotlilb.
It does not mean that you need to use it for your entire analysis, but for trends and oscillations analysis over a time period, Plotly is very handy.
You can see how easy it is from the figure below.

That's it for the Technical Part!
Follow me on LinkedIn for more daily ML breakdowns.
Let's dive into the Career part!
2. ML Career Section
3 tips for your ML income growth
These tips are based on 7+ years in ML and coaching 70+ people.
They work — and they work especially well if you’re in your first one to six years in a Machine Learning career
The 3 tips are:
-
Learn how to lead ML teams
-
Specialize in 1–3 ML or business domains
-
Be present online and network actively
Why do these actions help?
→ Leadership = Higher pay
You don’t need a manager title.
But you do need to take ownership, lead small projects, and drive outcomes.
People who lead, earn more.
→ Domain depth = Higher value
Trying to learn “everything ML” leads nowhere.
Knowing 1–2 domains deeply makes you stand out.
Companies pay more for focused expertise.
→ Visibility = More opportunities
If no one knows what you do, no one can hire you.
Posting online, sharing projects, and connecting with others bring jobs, freelance gigs, and credibility.
This is the rule of 2025: "If you don't exist online, you don't exist".
Hope this helps in your ML Career Journey!
Useful articles
- LASSO regression vs Ridge regression - when to use what? Why is Data
- Drift in ML is important to monitor
That is it for this week!
If you haven’t yet, follow me on LinkedIn where I share Technical and Career ML content every day!
Whenever you're ready, there are 3 ways I can help you:
1. ML Career 1:1 Session
I’ll address your personal request & create a strategic plan with the next steps to grow your ML career.
2. Full CV & LinkedIn Upgrade (all done for you)
I review your experience, clarify all the details, and create:
- Upgraded ready-to-use CV (Doc format)
- Optimized LinkedIn Profile (About, Headline, Banner and Experience Sections)
3. CV Review Session
I review and show major drawbacks of your CV & provide concrete examples on how to fix them. I also give you a ready CV template to make you stand out.
Join Maistermind for 1 weekly piece with 2 ML guides:
1. Technical ML tutorial or skill learning guide
2. Tips list to grow ML career, LinkedIn, income