R-Squared - Definition, Interpretation, Calculation, Pros & Cons
Feb 15, 2025
Estimated reading time - 7 minutes
Intro
R-squared (R², coefficient of determination, goodness of fit) measures how much variation in the dependent variable is explained by the independent variable(s). It ranges from 0 to 1, where 1 indicates a perfect fit of the model to the data.
Among many regression model metrics, R-squared is arguably the most famous one and is widely used in Machine Learning and Statistical Analysis.
However, there are several important pitfalls and surprising facts about R-squared which make it a poor performance measure.
In this blog post, we will look deeper at both advantages and disadvantages with a specific emphasis of when NOT to use R-squared.
R-squared Definition
Here is the formula of R² score
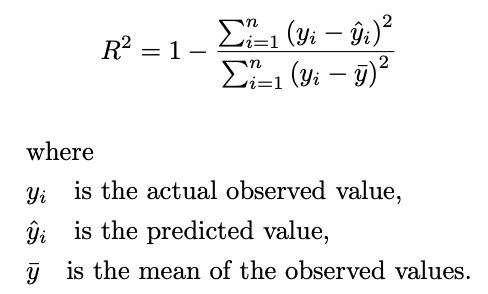
If we closely look at the formula, we see that R² estimates how much variance is explained by the fitted model compared to a simple mean model (total variance). Let's see this with a very simple linear model example and break down the R² formula definition.
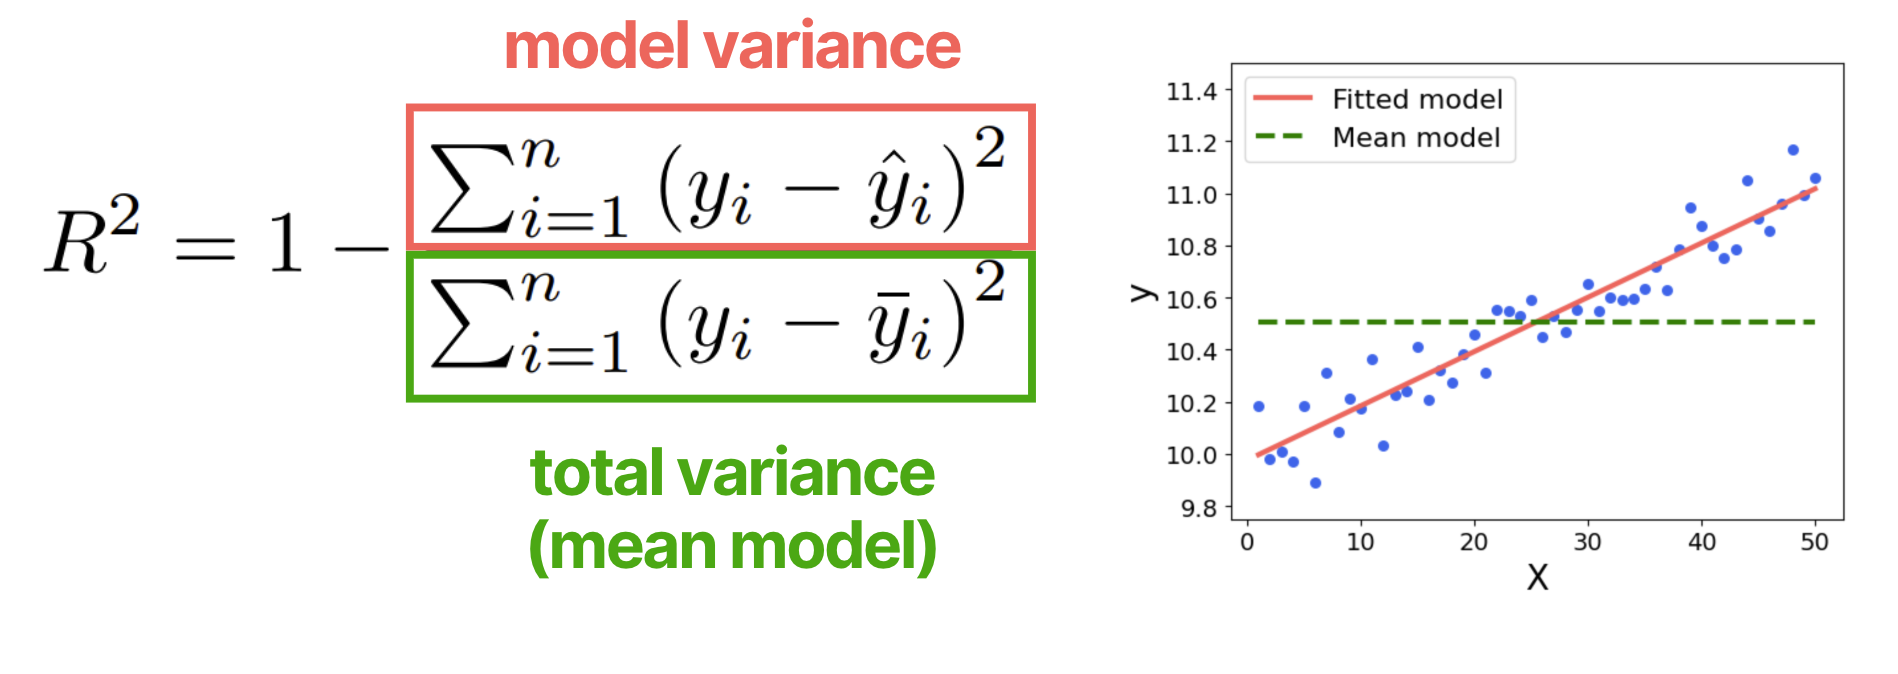
In simple terms it means that R² compares how much our model is better than a simple mean value prediction model. Already from here it's clear that it's quite easier to be better than a simple average model, so in many cases it might not be really a good measure.
Let us now see advantages and disadvantages of R² in more detail.
R-squared Advantages
1. Handles Different Data Ranges (Scale Independent)
R² does not depend on scale of the target which makes it handy to compare the models for different datasets or dataset ranges of the same problem.
Suppose Model A is predicting house prices in one country where prices range from $50,000 to $500,000, while Model B predicts in another country where prices range from $200,000 to $2,000,000.
Directly comparing errors like RMSE is unfair because the scale differs. R², however, tells you how well each model explains the proportion of variation in its respective dataset.
2. Detects Poor Models Easily
If R² is close to 0 (or even negative), it signals that the model is not useful in predicting the target variable.
3. Baseline Comparison
R² helps assess how well the model performs relative to a simple mean-based model. If it's too low, then most likely your features are bad predictors and even a more complex model will not fix the issue.
R-squared Disadvantages
1. High R² does NOT mean a good model
When evaluating the metrics, what you want to eventually do is to understand if you made a good fit of data. Let's look at the following example.
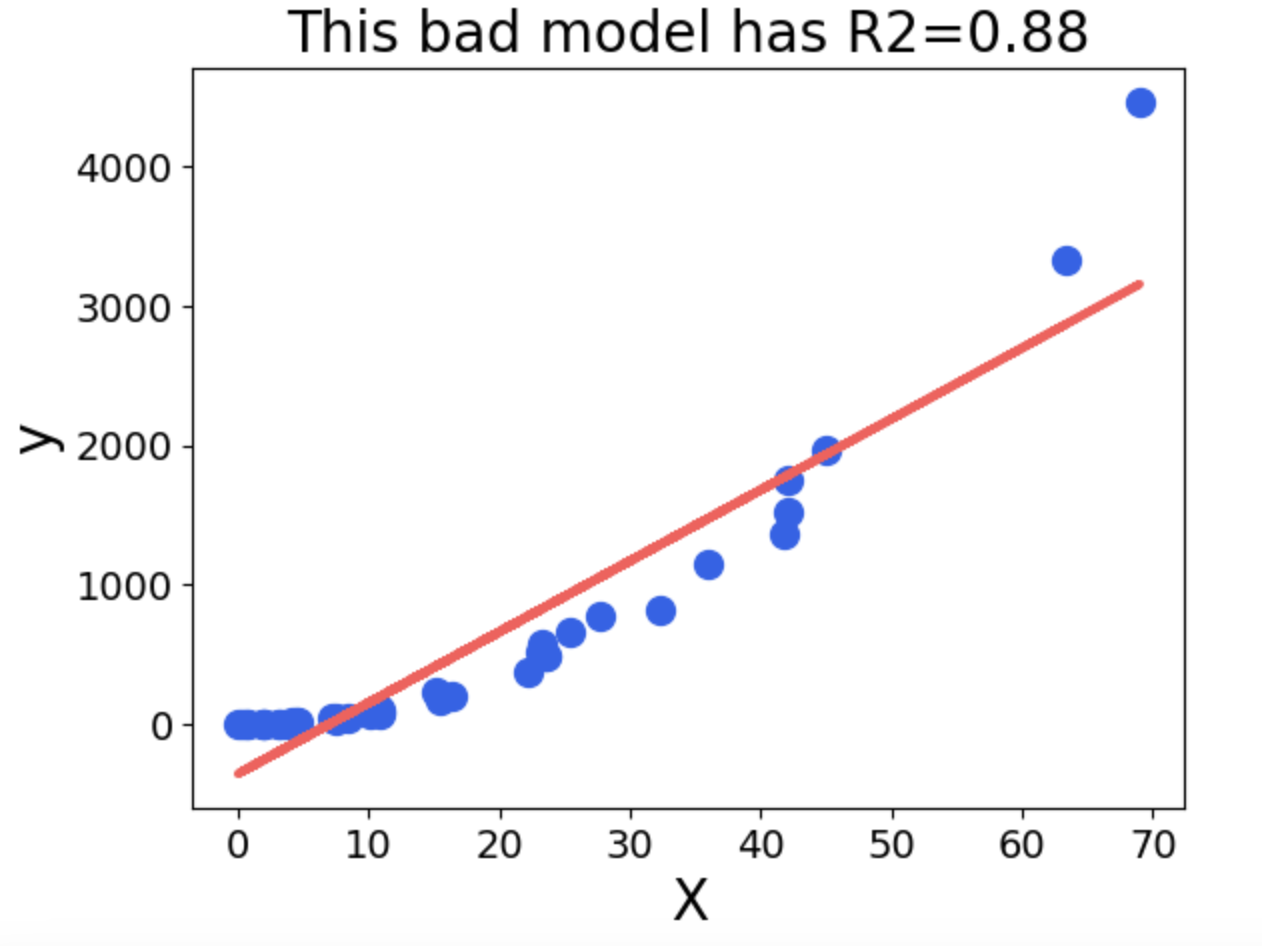
We see that the model does not describe the parabolic pattern of the data. However, it has a fairly high R². This means that looking solely at high R² can be misleading.
2. Low R² does NOT mean a bad model
Another problem is that in some cases we can't build a very accurate model due to the noise in the data. Imagine we have a linear feature-target dependence but the noise forces R² be low. See the example below.
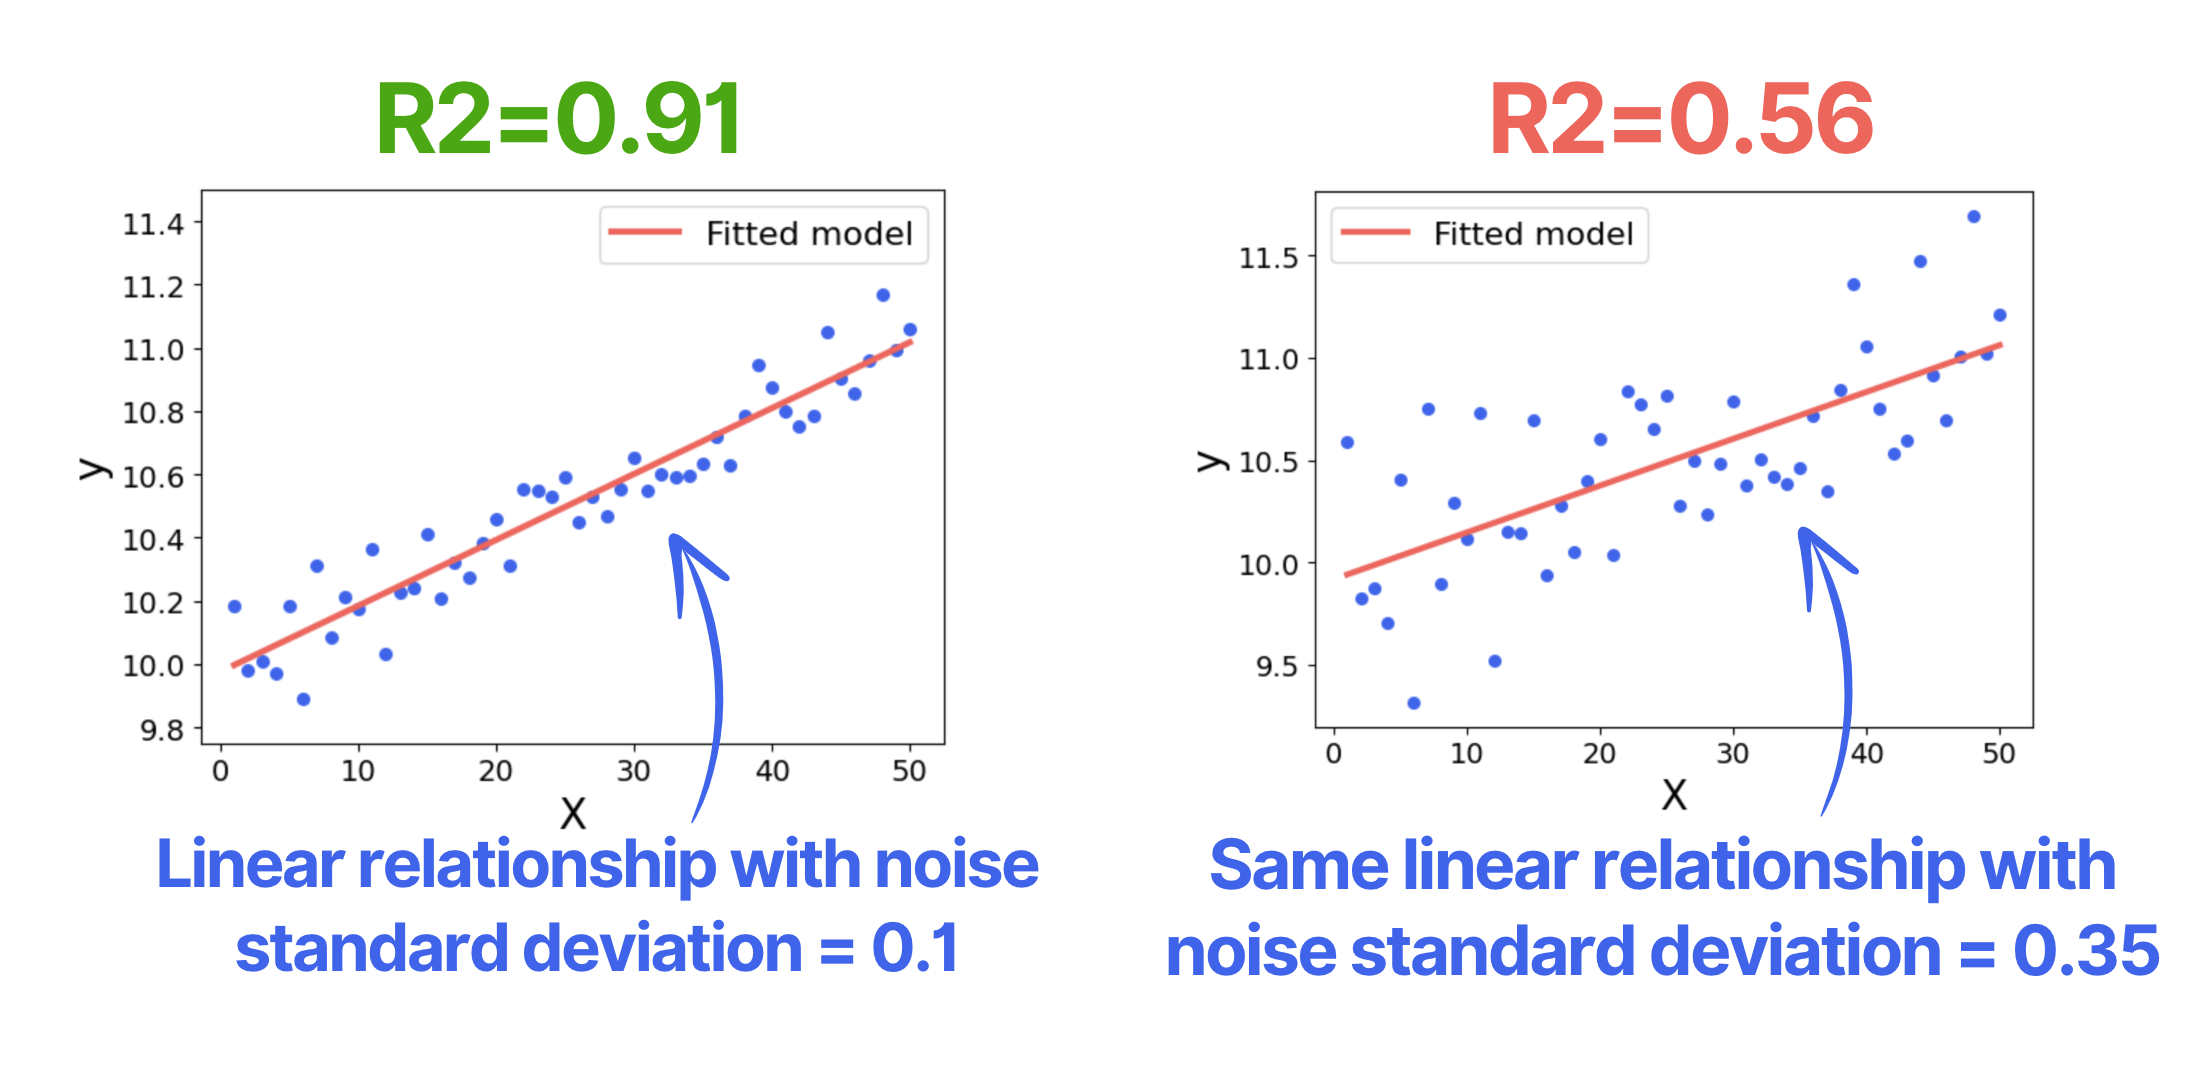
We see that for the same linear relationship with difference data noise level R² reduces dramatically. However, we can't build a better model! This is the linear trend data and the model with R²=0.56 is the best we can theoretically do.
This again shows the point that the R² value itself doesn't mean much without the context and can lead to wrong conclusions.
3. R² is greatly affected by outlying values
In some cases, you can't get rid of values that are outlying general trend or haven't cleaned the data enough. In this case, R2 can be very misleading. Let's consider the figure below.
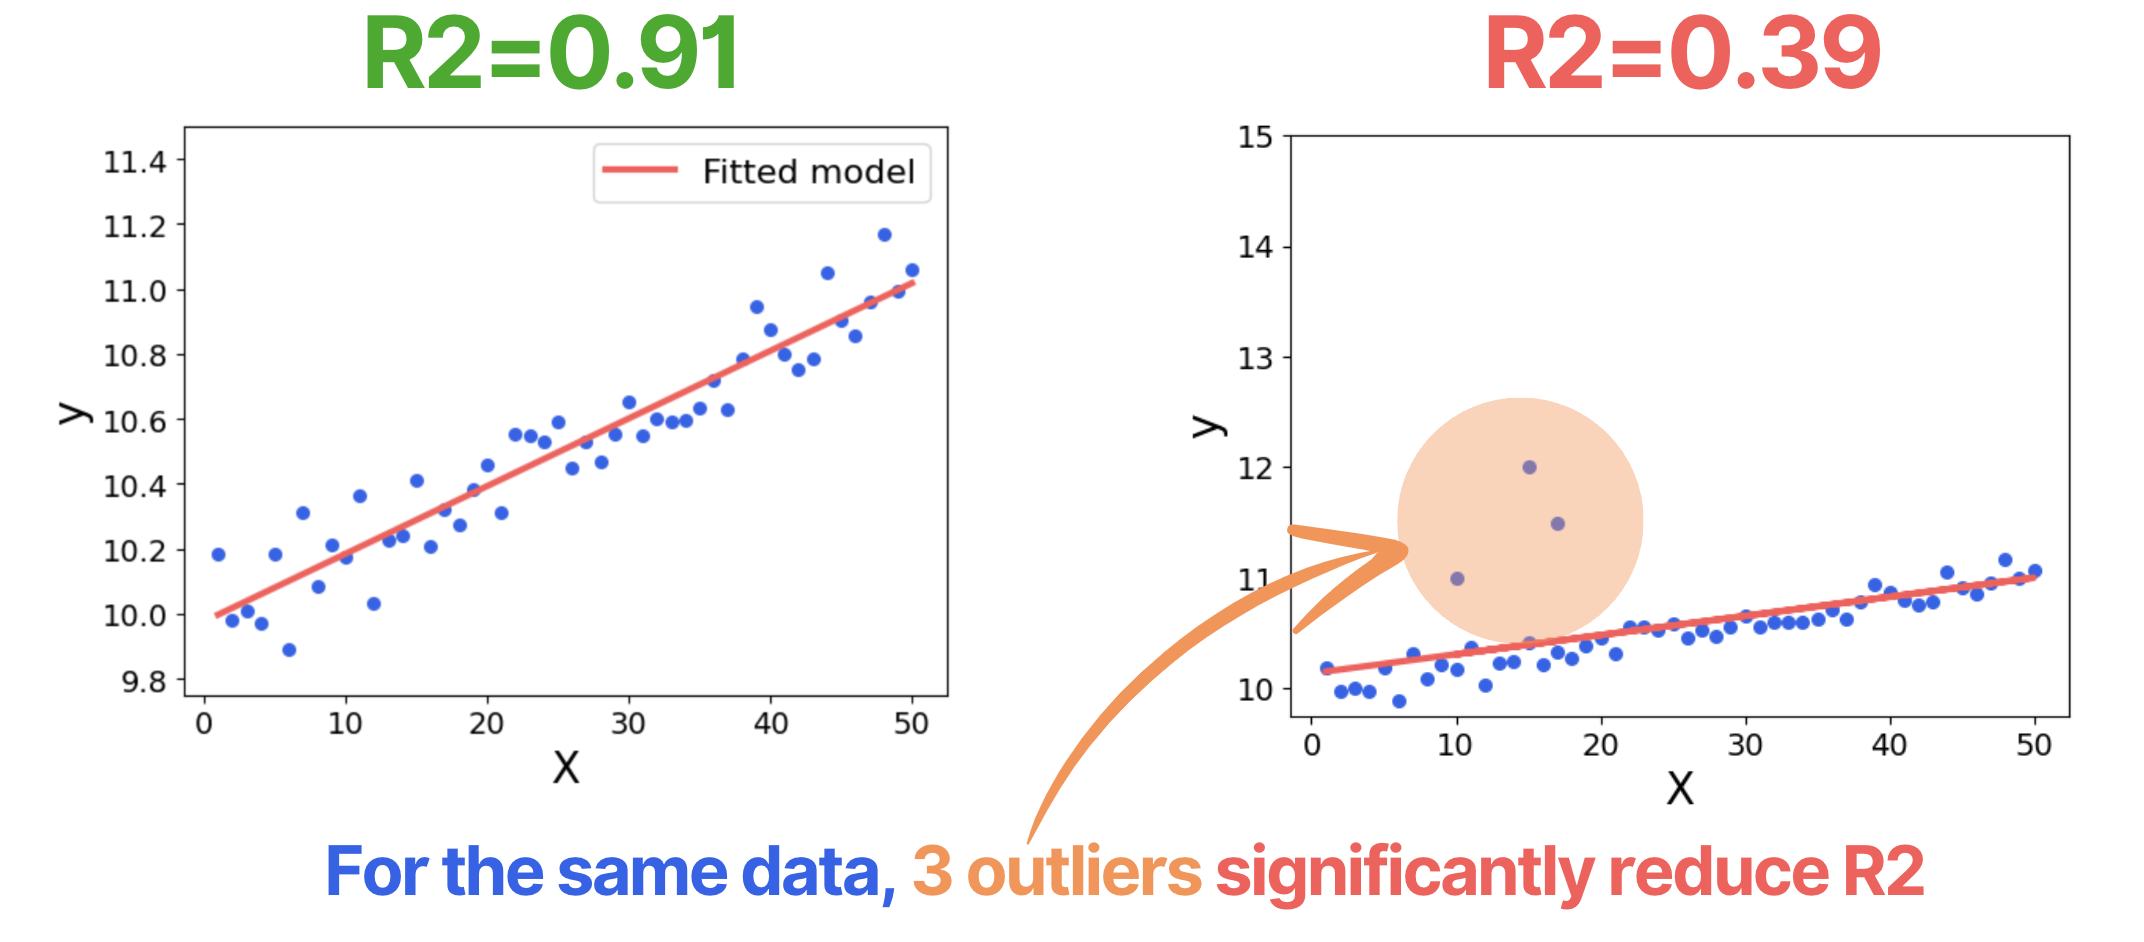
The problem is that these outliers might not be obvious in many cases or you can't delete them because the data is genuine. This makes R2 confusing and leading to wrong conclusions about the model performance.
4. R² increases as the number of feature increases
This can be surprising to many (it was to me), but as you add more features to your model, R² will either stay the same or increase. This happens because the model is always optimizing MSE, which is essentially the numerator of R².
If the added feature is a poor predictor, it won’t contribute to reducing MSE or increasing R². However, if it helps reduce the error even slightly, the R² score will increase.
The problem is that adding more features doesn't necessarily improve the model—it can make it unnecessarily complex and may negatively impact other evaluation metrics.
Therefore, you have to be very cautious when comparing different models based on R-squared.
Decision guide: how to properly use R²?
Given the pitfalls of R², it’s essential to interpret it correctly and combine it with other evaluation metrics when assessing regression models. These are several guidelines of how to account for R-squared pitfalls while still take advantage of the metric.
When NOT to use R-squared for model evaluation
1. Avoid using R-squared for non-linear model evaluation.
As we discussed, R² can be high even though your model doesn't capture the non-linear relationships between the target and features. For non-linear data, other metrics are more reliable, for example:
- Root Mean Squared Error (RMSE)
- Mean Absolute Percentage Error (MAPE)
- Mean Absolute Error (MAE)
2. Avoid using R-squared as a standalone metric
To make sure that R² indeed represents a good or bad model performance, it's preferable to use it together with other metrics listed above - RMSE, MAPE and MAE.
3. Avoid using R-squared for feature selection
As R-squared always increases with the number of features, it's not feasible to use for feature selection.
Which tasks R-squared is good for?
1. Use R-squared to access linear models on near-linear data
R² was originally designed to assess linear model performance for data with near-linear relationships. Indeed, it can be a good metric in this case but make sure the data doesn't have outliers.
2. Use R-squared to quickly access model performance
In most cases, if R² < 0.2 or even negative, the model doesn't perform well. Since R² is dimensionless and well-understood, it is handy for quick model evaluation and understanding your model works well and better than a simple average model.
To stay up to day with my articles and roadmaps both on the technical and career part of your ML journey, subscribe to my weekly newsletter below!